
Data Science Project Tutorial: Exploring Analytics & Data Science Salary Data


Every year, the Ask a Manager blog does a salary survey and shares the raw data with anyone who wants to view it.
I decided to explore the data from the 2023 survey to see what I could learn about Analytics & Data Science salaries, and also how the industry compares to other jobs.
Some of the questions I wanted to answer:
What were the average salaries of the most common data-related jobs?
How does the data industry compare to other jobs overall?
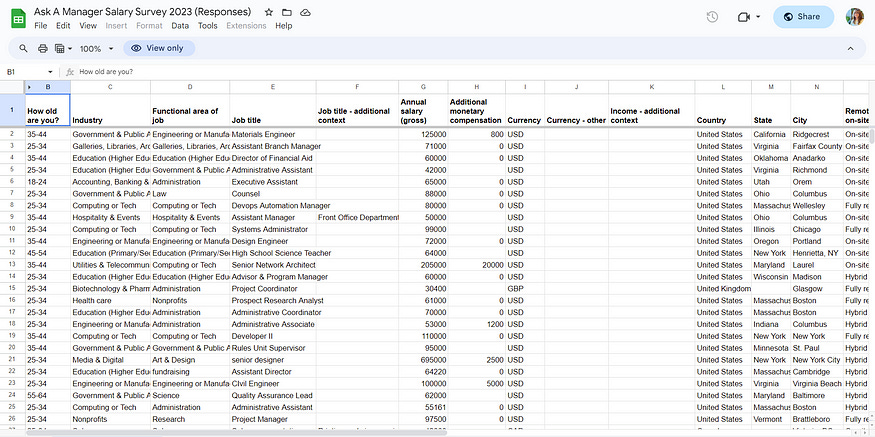
The survey goes live in April, and I downloaded the data in August. There were 16,888 submissions at the time of my download. After doing minimal data cleaning (convert to lowercase, remove any leading or trailing spaces, and replace “sr” and “sr.” with “senior), there were 8,739 unique job titles.
Data Biases
Before I share my insights, a little disclaimer. I know the data from this survey is not a perfect representation of all jobs. It is likely going to skew towards people working in white-collar jobs, and as you’ll see below, women are over 75% of the responses.
Additionally, once I dug into the data based on specific job titles and levels, the number of responses got very small, generally too small to be truly representative.
There are many other sources of salary information out there, I highly recommend consulting multiple sources if you are trying to do research for salary negotiation.
Note: This tutorial assumes that you are familiar with:
Read the data into a Pandas dataframe
Also check the size of the dataframe and column names.
df = pd.read_csv('Ask A Manager Salary Survey 2023.csv')
print(df.shape)
df.columns
Data Cleaning
Start with some basic data cleaning to reduce duplicates:
# convert job titles and education to lower case
df['job_title'] = df['Job title'].str.lower()
df['education'] = df['Highest level of education completed'].str.lower()

# remove whitespace at the beginning or end
df['job_title'] = df['job_title'].str.strip()

# replace "sr" or "sr." to "senior"
df['job_title'] = df['job_title'].apply(lambda x: x.replace('sr ','senior '))
df['job_title'] = df['job_title'].apply(lambda x: x.replace('sr.','senior'))
I separated out any “data” related job titles. This included any job title with one or more of the following words or terms: data, analytic, machine learning, ml, applied scientist, decision, insights, measurement, reporting, intelligence, or predictive.
I did not include the word “analyst” because I find that unless it is preceded by “data”, it is not strictly a “data analyst” role.
df["data_job"] = np.where(df["job_title"].str.contains('data|analytics|machine learning|ml|decision|insights|measurement|intelligence|predictive', regex= True, na=False), 'yes', 'no')
df.loc[df['data_job']=='yes'].head()
There were 527 data-related submissions with 306 unique job titles.
print('Submissions by Top 5 most represented countries, percent:')
(df['Country'].value_counts(normalize=True)*100).to_frame().head(5)
Additionally, Close to 83% of the submissions were from the United States. Because salaries and other factors can vary so much by country and other countries weren’t well-represented, I filtered my analysis to just submissions from the US.
# create dataframe for just the US:
df_usa = df.loc[df['Country']=='United States']
I also grouped data jobs together by job family (data analyst, data scientist, data engineering, etc) and job level (entry, mid, senior, lead/staff/principal, manager, director, VP).
# Group similar job functions together

df_data["job family"] = np.where(df_data["job_title"].str.contains('data scientist', regex= True, na=False), 'data scientist',
                                 np.where(df_data["job_title"].str.contains('analyst', regex= True, na=False), 'data analyst',
                                 np.where(df_data["job_title"].str.contains('analysis', regex= True, na=False), 'data analyst',
                                 np.where(df_data["job_title"].str.contains('engineer', regex= True, na=False), 'data engineer',
                                 np.where(df_data["job_title"].str.contains('developer', regex= True, na=False), 'data engineer',
                                 np.where(df_data["job_title"].str.contains('architect', regex= True, na=False), 'data engineer',
                                 np.where(df_data["job_title"].str.contains('business intelligence', regex= True, na=False), 'business intelligence',
                                 np.where(df_data["job_title"].str.contains('visualization', regex= True, na=False), 'business intelligence',
                                 np.where(df_data["job_title"].str.contains('database', regex= True, na=False), 'database',
                                 np.where(df_data["job_title"].str.contains('analytics', regex= True, na=False), 'analytics',
                                 np.where(df_data["job_title"].str.contains('machine learning', regex= True, na=False), 'machine learning',
                                 np.where(df_data["job_title"].str.contains('data science', regex= True, na=False), 'data scientist',
                                 np.where(df_data["job_title"].str.contains('science', regex= True, na=False), 'data scientist',
                                 np.where(df_data["job_title"].str.contains('scientist', regex= True, na=False), 'data scientist',
                                 np.where(df_data["job_title"].str.contains('governance', regex= True, na=False), 'data governance',
                                 np.where(df_data["job_title"].str.contains('quality', regex= True, na=False), 'data governance',
                                 np.where(df_data["job_title"].str.contains('integrity', regex= True, na=False), 'data governance',
                                 np.where(df_data["job_title"].str.contains('intelligence', regex= True, na=False), 'intelligence',
                                 np.where(df_data["job_title"].str.contains('consultant', regex= True, na=False), 'consultant',
                                 np.where(df_data["job_title"].str.contains('modeling', regex= True, na=False), 'data scientist',
                                 np.where(df_data["job_title"].str.contains('entry', regex= True, na=False), 'data entry',
                                 np.where(df_data["job_title"].str.contains('clerk', regex= True, na=False), 'data entry',
                                 np.where(df_data["job_title"].str.contains('collection', regex= True, na=False), 'data entry',
                                 np.where(df_data["job_title"].str.contains('insights', regex= True, na=False), 'data analyst',
                                 np.where(df_data["job_title"].str.contains('processor', regex= True, na=False), 'data analyst',
                                 np.where(df_data["job_title"].str.contains('informatics', regex= True, na=False), 'informatics',
                                 np.where(df_data["job_title"].str.contains('specialist', regex= True, na=False), 'data analyst',

'other')))))))))))))))))))))))))))
# Group similar job levels together
df_data["job level"] = np.where(df_data["job_title"].str.contains('senior', regex= True, na=False), 'senior',
np.where(df_data["job_title"].str.contains('lead', regex= True, na=False), 'lead/staff/principal',
np.where(df_data["job_title"].str.contains('principal', regex= True, na=False), 'lead/staff/principal',
np.where(df_data["job_title"].str.contains('staff', regex= True, na=False), 'lead/staff/principal',
np.where(df_data["job_title"].str.contains('manager', regex= True, na=False), 'manager',
np.where(df_data["job_title"].str.contains('head', regex= True, na=False), 'manager',
np.where(df_data["job_title"].str.contains('supervisor', regex= True, na=False), 'manager',
np.where(df_data["job_title"].str.contains('director', regex= True, na=False), 'director',
np.where(df_data["job_title"].str.contains('VP', regex= True, na=False), 'VP',
np.where(df_data["job_title"].str.contains('vice president', regex= True, na=False), 'VP',
np.where(df_data["job_title"].str.contains('officer', regex= True, na=False), 'VP',
np.where(df_data["Years of experience in field"].str.contains('1 year or less', regex= True, na=False), 'entry',
'mid'))))))))))))Note: It was hard to decipher entry and mid-level roles by title alone because they are often the same. “Entry” was defined as someone reporting to be in their role for “1 level or less” and if the title didn’t indicate one of the other levels listed above, “mid” was assigned.
Exploring Data Salaries
The dataset had two columns for pay :
“Annual salary (gross)” — the survey specifies this should be gross pre-tax income for full-time hours.
“Additional monetary compensation” — the survey specifies this should be bonuses or overtime but not the value of other benefits.
I created a “total compensation” column that added the two together.
# create total compenstation column
df['total comp'] = df['Annual salary (gross)'] + df['Additional monetary compensation']
And then compared base salary and total compensation:
avg_non = df_usa.loc[df_usa['data_job']=='no']['Annual salary (gross)'].mean()
avg_data = df_usa.loc[df_usa['data_job']=='yes']['Annual salary (gross)'].mean()
lift = (avg_data-avg_non)/avg_non

print('Average salary:\n')
print(df_usa.groupby('data_job')['Annual salary (gross)'].mean())
print('\nData jobs paid', round(lift*100,1), '% more')
Data jobs had an average annual salary of $110,938 whereas non-data jobs had an average annual salary of $101,073. Data jobs paid 9.8% more than non-data jobs.
avg_non = df_usa.loc[df_usa['data_job']=='no']['total comp'].mean()
avg_data = df_usa.loc[df_usa['data_job']=='yes']['total comp'].mean()
lift = (avg_data-avg_non)/avg_non

print('\nAverage total compenstation:')
print(df_usa.groupby('data_job')['total comp'].mean())
print('\nData jobs paid', round(lift*100,1), '% more')
For total annual compensation, data jobs paid $129,029 and non-data jobs paid $115,362. Data jobs paid 11.8% more.
Within data jobs, I took a look at averages by job family and job level to better understand how their average annual base salaries compared.
print('Average salary by job family & count of submissions by top 10 most popular job title:')
df_data.groupby('job family').agg({
    'Annual salary (gross)':'mean', 'Timestamp':'count'
    }).reset_index().sort_values(by='Timestamp', ascending=False).round(0).head(10)
In terms of the job family, the most popular and their average base salary:
Data Analyst: $87,718
Data Scientist: $149,365
Analytics: $141,109 — this term was usually used for managerial roles
Data Engineer: $130,470
And looking further into each job family, reporting salary by levels where there were 5 or more salaries reported:
job_fam_list = df_data['job family'].unique()
for job in job_fam_list:

    #create table filtered to job family
    df_temp = df_data.loc[df_data['job family']==job]

    #group data by level to find average
    df_temp2 = df_temp.groupby(['job level']).agg({
        'Annual salary (gross)':'mean', 'Timestamp':'count'
        }).round(0).reset_index().sort_values(by='Annual salary (gross)', ascending=False)

    df_temp2 = df_temp2.rename(columns={"Annual salary (gross)": "Average Salary", "Timestamp": "Count"})

    #filter to jobs with at least 5 submissions
    df_temp3 = df_temp2.loc[df_temp2['Count']>=5]

    #if there's enough data, create a bar graph with average salary by level:
    if df_temp3.shape[0]>0:
        sns.barplot(data=df_temp3, x="job level", y="Average Salary");
        plt.xticks(rotation=45);
        plt.title(job)
        plt.show()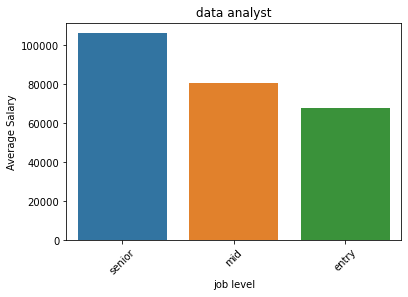
Data Analyst salaries averaged from $70,000 for entry-level, $80,000 for mid-level, and just over $100,000 for senior.
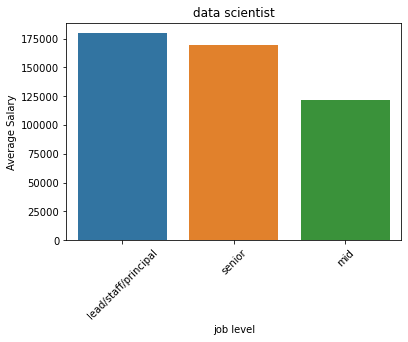
Data Scientist salaries averaged $125,000 for mid-level, around $170,000 for senior, and $175,000 for lead/staff/principal roles.
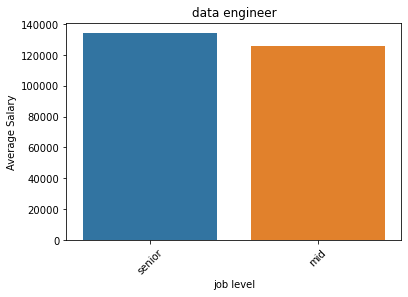
Data Engineers averaged $125,000 for mid-level and $135,000 for senior.
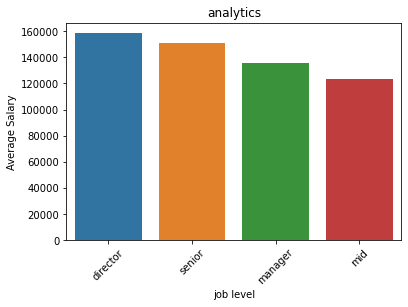
When “Analytics” was used, it was usually for a managerial role. However, some companies use the title “Analytics Manager” as a functional, non-people manager role. It’s hard to know for sure based on the title alone. Regardless, salaried averaged around $120,000 for mid-level, $130,000 for manager, $150,000 for senior (possibly senior manager based on the logic of my code), and close to $160,000 for director.
Other Trends
The salary survey included non-compensation questions, such as age, gender, education, tenure (in your field and working overall). I was curious how data jobs compared to non-data jobs, and how data job families compared.
Education
print('Highest level of education completed')
(df_data_2.groupby('job family')['Highest level of education completed'].value_counts(normalize=True)*100).to_frame()
Comparing data jobs to non-data jobs, the highest degree completed:
PhD: 12% of those in data jobs, 6% of non-data jobs
Masters: 37% of those in data jobs, 34% of non-data jobs
Bachelors: 43% of those in data jobs, 46% non-data jobs
Overall, 92% of respondents working in data jobs reported having at least a bachelor's degree compared to 86% of those in non-data jobs.
Digging into job family:
Data Scientists:
45% had a PhD (2% had a JD or MD or similar)
27% had a masters
27% had a bachelors
Data Engineers:
8% had a PhD
38% had a masters
49% had a bachelors
5% had not finished at least a bachelors
Data Analysts:
2% had a PhD
39% had a masters
49% had a bachelors
10% had not finished at least a bachelors
Gender
print('Gender, percent')
(df_data_2.groupby('job family')['Gender'].value_counts(normalize=True)*100).to_frame()
Overall, 77% of the respondents of the survey identified as women, which is likely a bit skewed from reality. Looking at the breakdown of the respondents within data jobs was also skewed compared to reality. Rather than reporting the percentages, looking at trends, Data Analysts had the highest percentage of respondents who identified as women, and Data Scientists had the lowest percentage of women.
Conclusion
Overall, the outcome from the salary survey matched other research I’ve done:
Data jobs pay more than average
Data Science and Data Engineering roles pay more than Data Analyst
Data Scientists are more likely to have advanced degrees
If you’re looking for more information on salaries, I recommend:
Company-specific salaries via Glassdoor, Levels, Blind, H1B Database
Finally, if you’d like to view my code: https://github.com/maggiewolff/ask-a-manager-salary-survey/tree/main.